Kaart voor kwartaalomzet
Toon een kwartaallijn als vier stilstaande panelen op één kaart, met alleen de labels en cijfers die jij opgeeft.
Bijgewerkt:
Volledige prompt
Engelstalige prompt met een voorbeeldverzoek. Pas het onderwerp en de details aan voordat je genereert. De oorspronkelijke invoer en instellingen van de voorbeelden zijn niet volledig bevestigd.
Aanbevolen model: GPT Image 2.5 Flare
Prompttips
- Controleer of elk getal en de slotnoot overeenkomen met jouw tekst en er geen extra cijfers staan.
- De kaart is één stilstaand beeld; de lijn beweegt niet en er is geen GIF.
Bronnen en naamsvermelding
Aangepast en herschreven door OmniArt. Bronnen, wijzigingen en gebruiksvoorwaarden staan hieronder.
- Quarterly revenue chart animation · aiwarts
RaphaelAI-OpenLab/awesome-gpt-image-2.6
The collection's MIT license covers its code, templates and original documentation only; its LICENSE states that third-party prompts, reference images and example outputs keep their own rights. This template is independently authored; no source text or media is copied.
Replaced the fixed series, palette, and growth figure with user-supplied labels and values, and turned the moving chart into four still panels on one card. Source GIF workflow changed to a single still frame strip; no GIF or animation export is promised. The source collection labels this case GPT Image 2.6; GPT Image 2.5 Flare is a recommendation, not a verified example model.
Verwante promptrecepten

Alfabetobjectraster
Maak van één letter of naamregel een net 10×10-raster met honderd geïllustreerde objecten met labels op wit, klaar voor klasposters en woordenschatmateriaal.
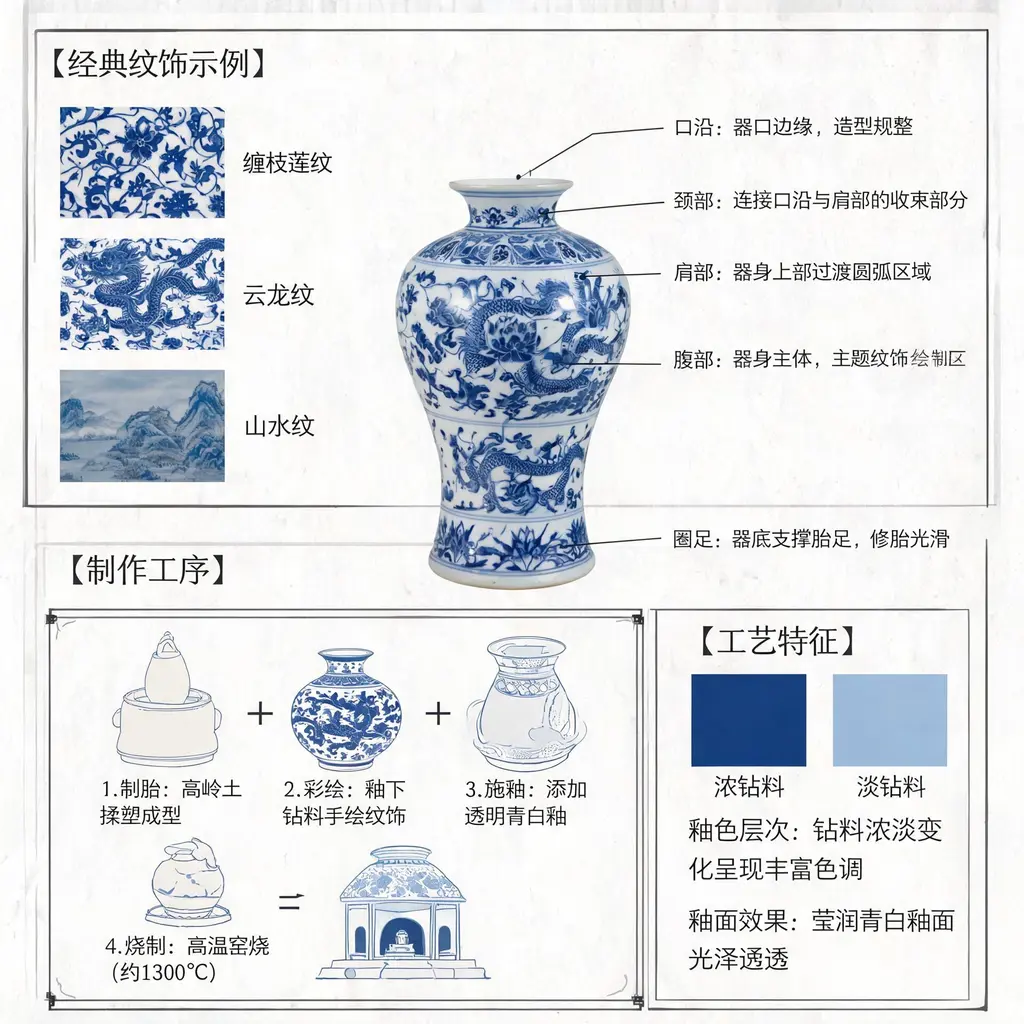
Diagram van blauw-wit porselein
Maak van Jingdezhen-porselein in blauw-wit een geannoteerd diagram op museumniveau, met structuurlijnen, close-ups van motieven en wetenschappelijke Chinese aantekeningen over het ambacht.

Schoolborduitleg
Zet elk onderwerp of artikel om in een met de hand getekend schoolbord vol krijtdiagrammen, pijlen en letterwerk, klaar om te delen als samenvatting in één afbeelding.
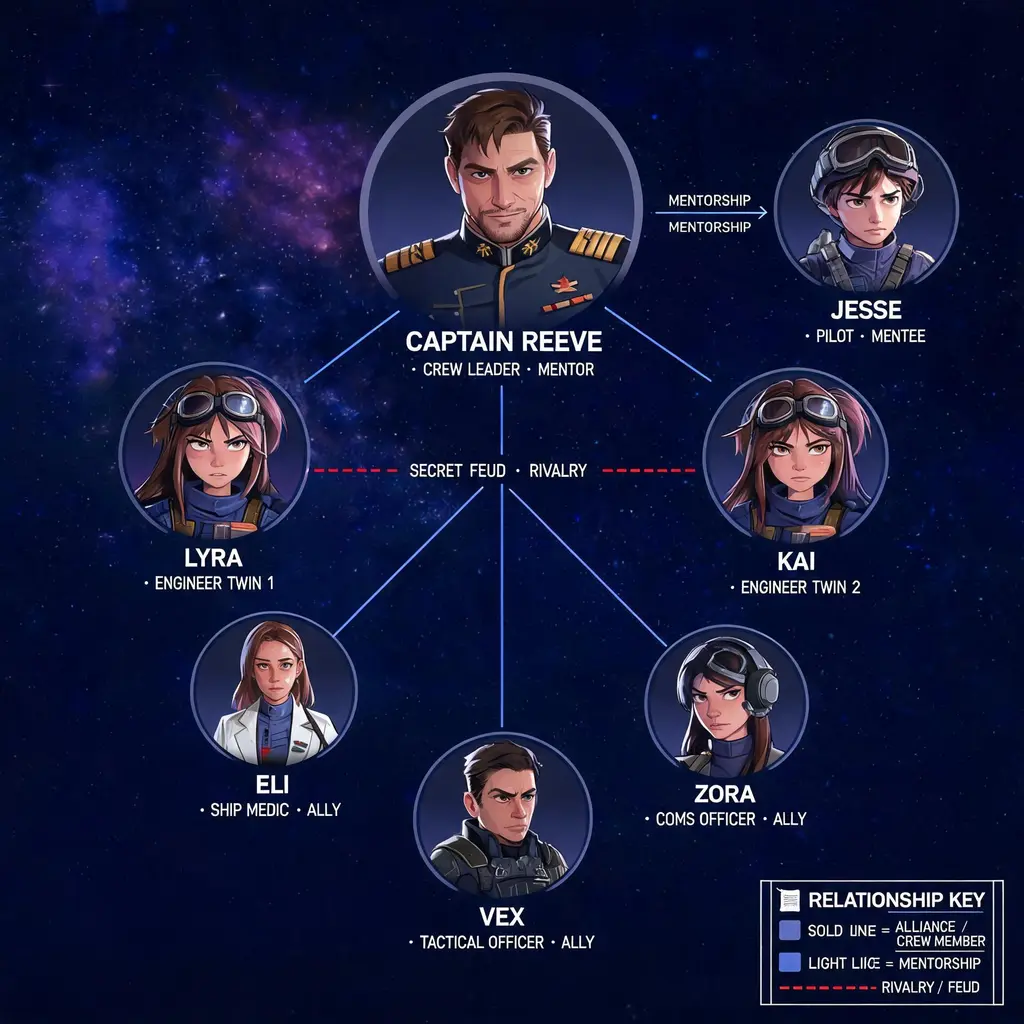
Relatiekaart van personages
Zet een groep personages om in een relatiekaart op posterniveau met kleurgecodeerde verbindingen, portretvignetten en een beeldtaal die uit het verhaal zelf komt.

Infographic over de reis van koffie
Volg een kop koffie van plantage tot kopje in een hoogwaardige infographicposter met vijf fasen, gegevensblokken, pictogrammen en een palet van koffiebruin en koper — klaar voor in de zaak.
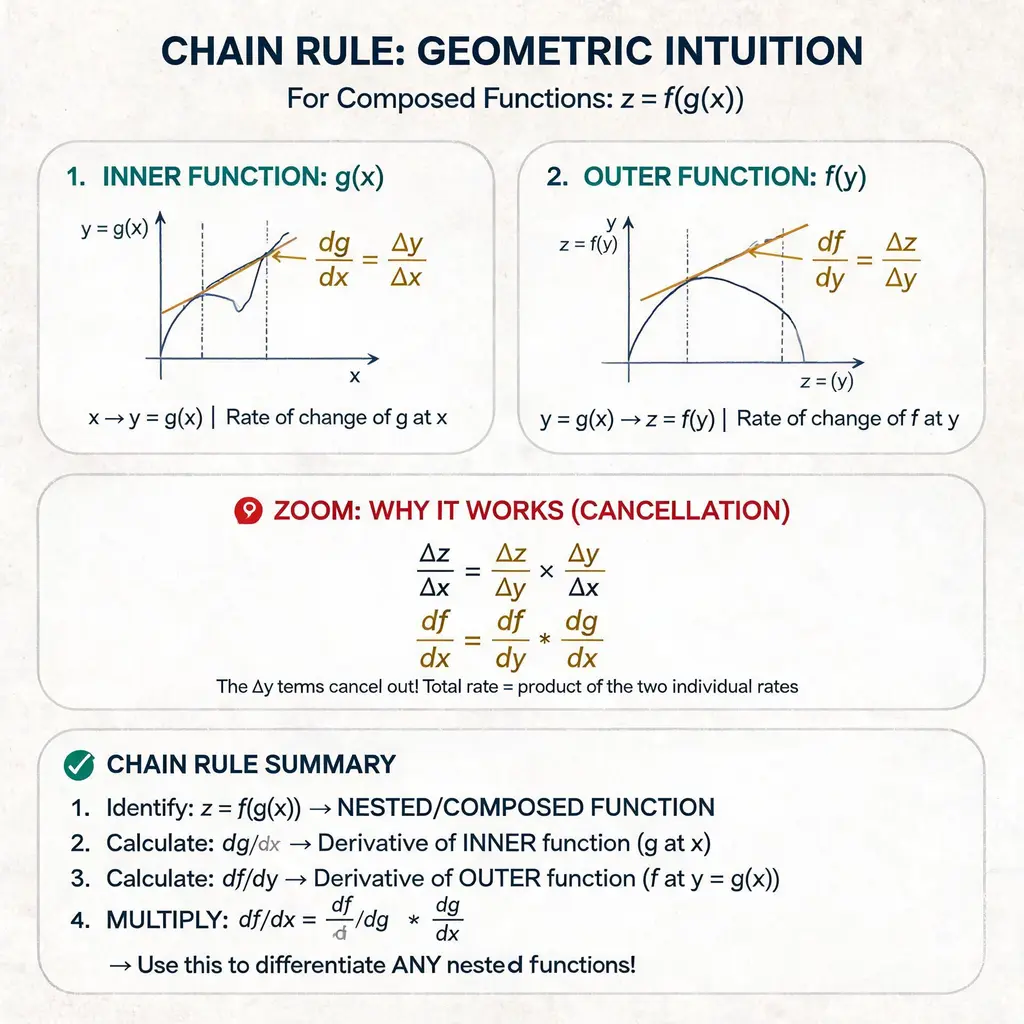
Collegehand-out
Leg elk begrip uit — wiskunde, techniek of systemen — als een strakke hand-out op papier met genummerde labels, met de hand getekende pijlen, uitvergrote details en een samenvatting, als een fraai collegeblad.