분기 매출 차트 카드
분기 꺾은선 차트를 한 장의 네 칸 정지 카드로 보여주고, 이름과 숫자는 입력한 내용만 사용합니다.
업데이트:
전체 프롬프트
입력 예시가 포함된 영어 프롬프트입니다. 생성 전에 대상과 세부 사항을 수정하세요. 원본 예시의 입력과 생성 설정은 완전히 확인되지 않았습니다.
추천 모델: GPT Image 2.5 Flare
프롬프트 작성 팁
- 모든 값과 마무리 문구가 입력과 같고 추가 숫자가 없는지 확인하세요.
- 카드는 정지 이미지이며 선이 움직이지 않고 GIF도 없습니다.
출처 및 크레딧
OmniArt가 재구성하고 다시 작성했습니다. 출처, 변경 사항 및 이용 조건은 아래에 표시됩니다.
- Quarterly revenue chart animation · aiwarts
RaphaelAI-OpenLab/awesome-gpt-image-2.6
The collection's MIT license covers its code, templates and original documentation only; its LICENSE states that third-party prompts, reference images and example outputs keep their own rights. This template is independently authored; no source text or media is copied.
Replaced the fixed series, palette, and growth figure with user-supplied labels and values, and turned the moving chart into four still panels on one card. Source GIF workflow changed to a single still frame strip; no GIF or animation export is promised. The source collection labels this case GPT Image 2.6; GPT Image 2.5 Flare is a recommendation, not a verified example model.
관련 프롬프트 레시피

알파벳 사물 그리드
글자 하나 또는 명명 규칙을, 흰 배경 위에 라벨 달린 일러스트 사물 100개가 가지런히 배열된 10×10 그리드로 바꿔 줍니다. 교실 포스터나 어휘 학습 자료로 좋습니다.
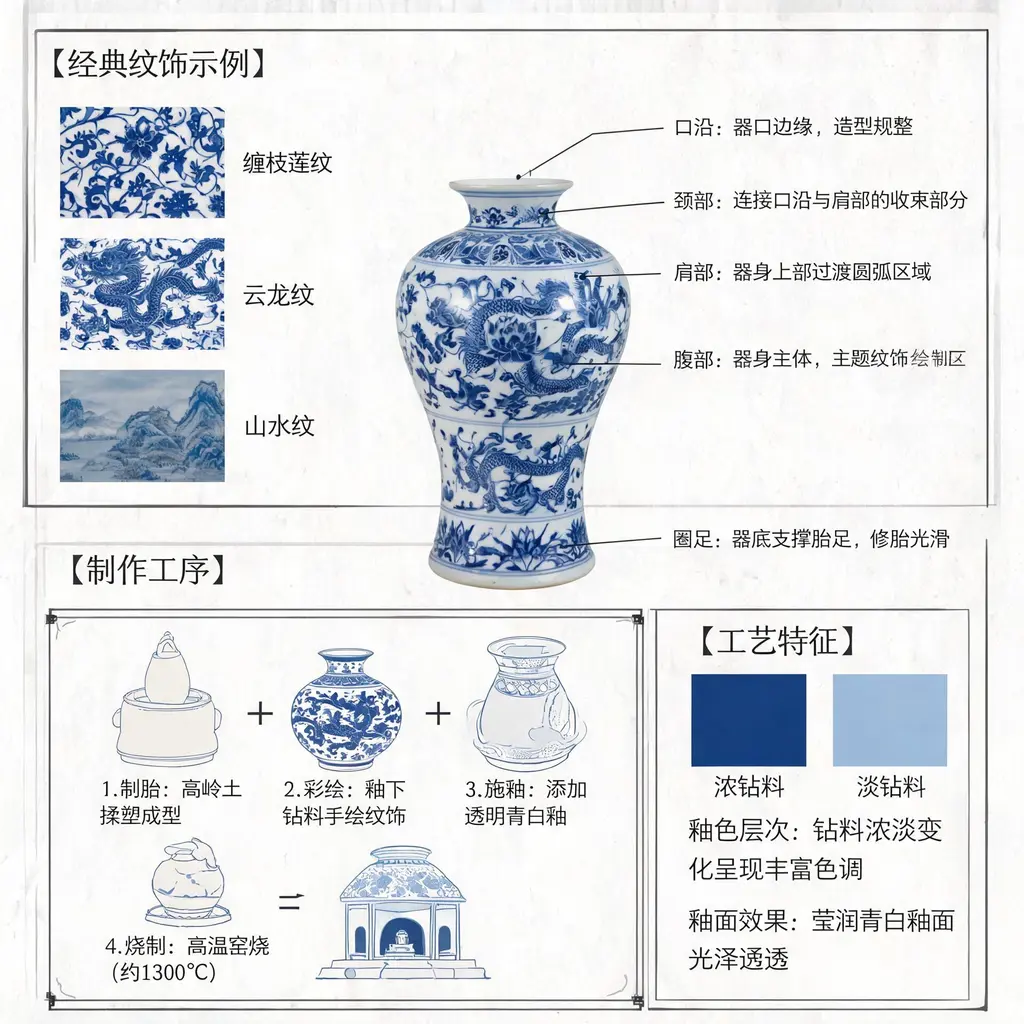
청화백자 해설도
징더전 청화백자를 구조 지시선과 문양 클로즈업, 공예에 관한 중국어 학술 주석을 갖춘 박물관급 해설 도해로 풀어냅니다.

칠판 해설 보드
어떤 주제나 글이든 분필 다이어그램, 화살표, 손글씨로 가득한 손그림 칠판 강의 보드로 바꿔, 한 장으로 공유할 수 있는 요약을 만듭니다.
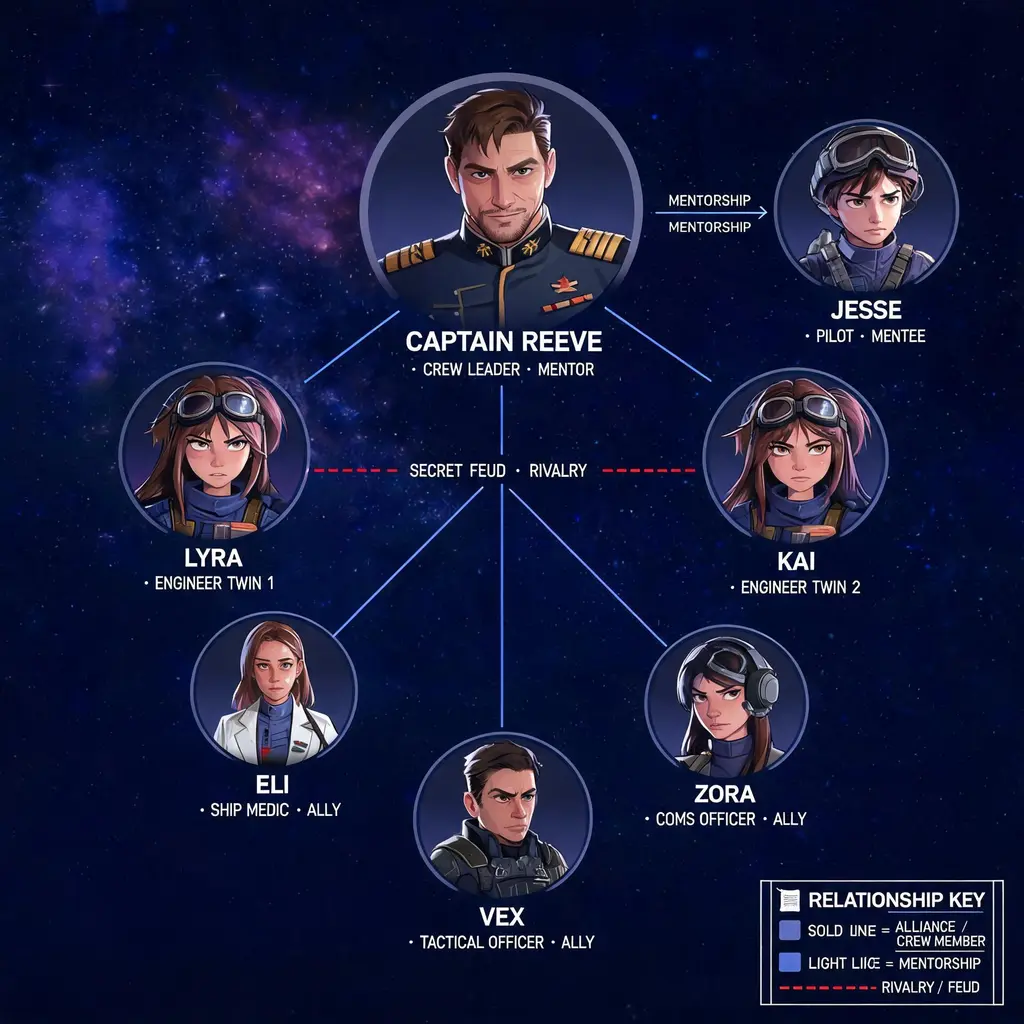
인물 관계도
등장인물들을 색으로 구분한 관계선, 초상 비네트, 이야기 세계관에서 가져온 스타일을 갖춘 포스터급 관계도로 만들어 줍니다.

커피 여정 인포그래픽
커피 한 잔이 농장에서 잔까지 오는 다섯 단계를 데이터 박스, 아이콘, 커피 브라운과 코퍼 팔레트로 담아낸 프리미엄 인포그래픽 포스터로, 카페 진열에 바로 쓸 수 있습니다.
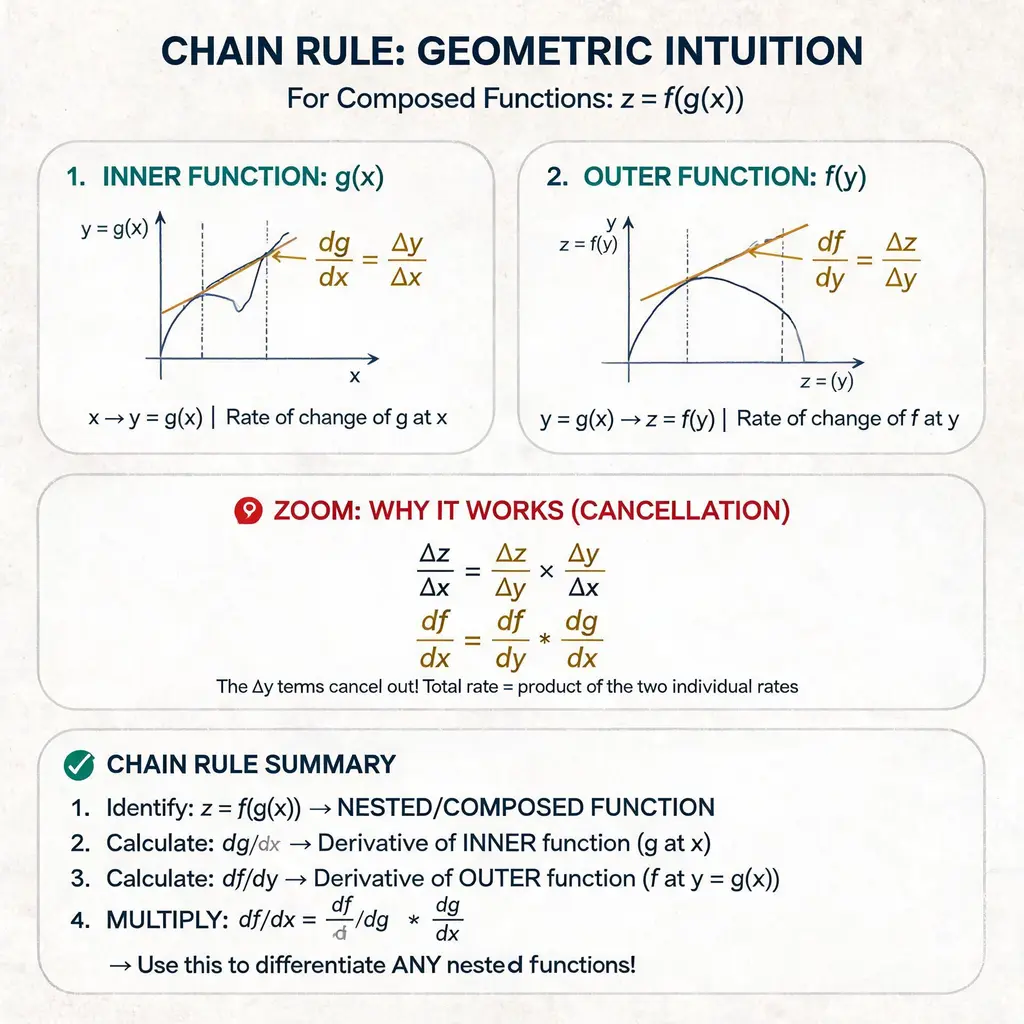
개념 강의 핸드아웃
수학, 기술, 시스템 등 어떤 개념이든 번호 라벨, 손그림 화살표, 확대 콜아웃, 요약 섹션을 갖춘 깔끔한 종이 질감 핸드아웃으로 설명합니다. 아름다운 강의 자료 한 장처럼 완성됩니다.