Kartu grafik pendapatan kuartal
Tampilkan grafik garis kuartalan sebagai empat panel diam pada satu kartu, hanya dengan label dan angka yang Anda beri.
Diperbarui:
Prompt lengkap
Prompt berbahasa Inggris dengan contoh permintaan. Sesuaikan subjek dan detail sebelum membuat kreasi. Input dan pengaturan contoh asli belum sepenuhnya terverifikasi.
Model yang disarankan: GPT Image 2.5 Flare
Tips membuat prompt
- Periksa setiap angka dan catatan penutup agar sesuai teks Anda, tanpa angka tambahan.
- Kartu ini satu gambar diam; garisnya tidak bergerak dan tidak ada GIF.
Sumber dan atribusi
Diadaptasi dan ditulis ulang oleh OmniArt. Sumber, perubahan, dan ketentuan penggunaan tercantum di bawah.
- Quarterly revenue chart animation · aiwarts
RaphaelAI-OpenLab/awesome-gpt-image-2.6
The collection's MIT license covers its code, templates and original documentation only; its LICENSE states that third-party prompts, reference images and example outputs keep their own rights. This template is independently authored; no source text or media is copied.
Replaced the fixed series, palette, and growth figure with user-supplied labels and values, and turned the moving chart into four still panels on one card. Source GIF workflow changed to a single still frame strip; no GIF or animation export is promised. The source collection labels this case GPT Image 2.6; GPT Image 2.5 Flare is a recommendation, not a verified example model.
Resep prompt terkait

Kisi objek alfabet
Ubah satu huruf atau aturan penamaan menjadi kisi 10×10 yang rapi berisi 100 objek ilustrasi berlabel di atas latar putih — cocok untuk poster kelas dan visual belajar kosakata.
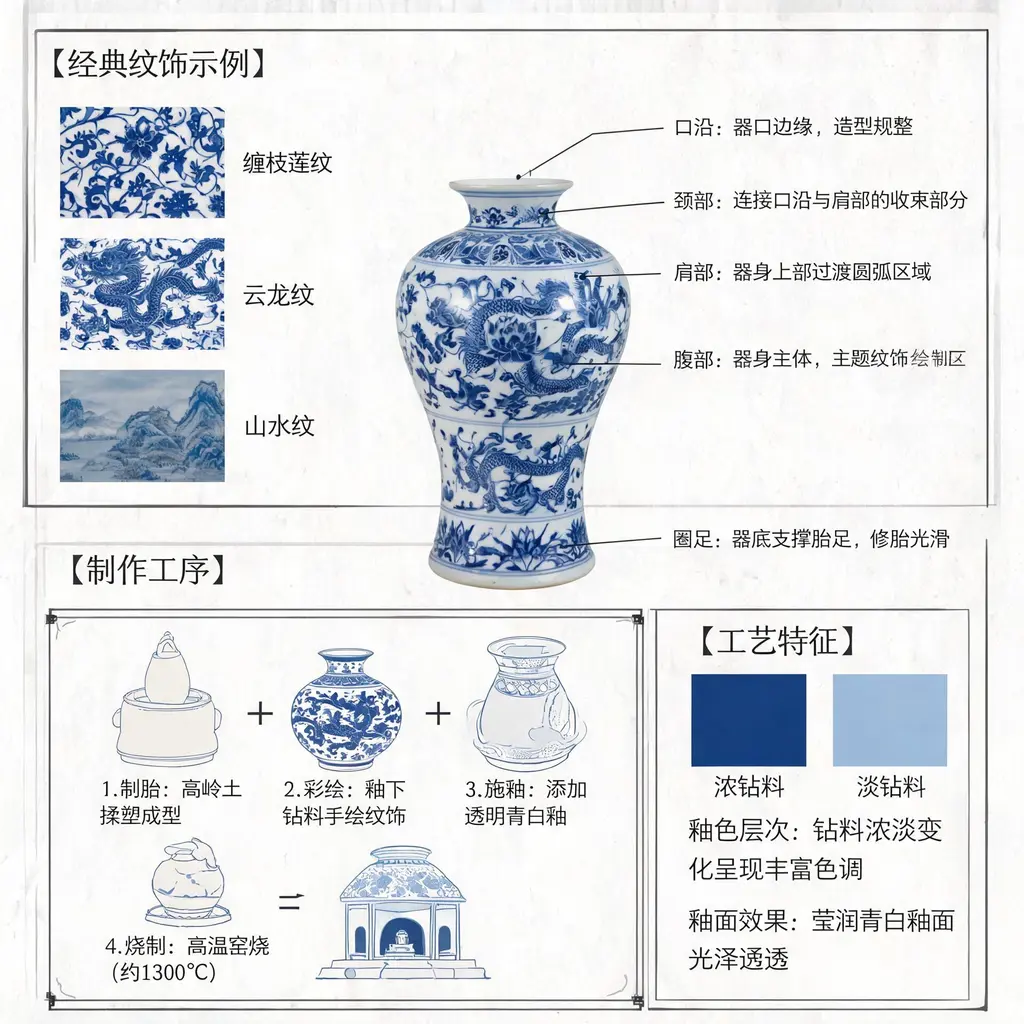
Diagram porselen biru-putih
Ubah porselen biru-putih Jingdezhen menjadi diagram beranotasi kelas museum, dengan garis penunjuk struktur, close-up motif, dan catatan ilmiah berbahasa Mandarin tentang kriyanya.

Papan tulis penjelas
Ubah topik atau artikel apa pun menjadi papan tulis kuliah gambar tangan yang penuh diagram kapur, panah, dan tulisan tangan, siap dibagikan sebagai ringkasan satu gambar.
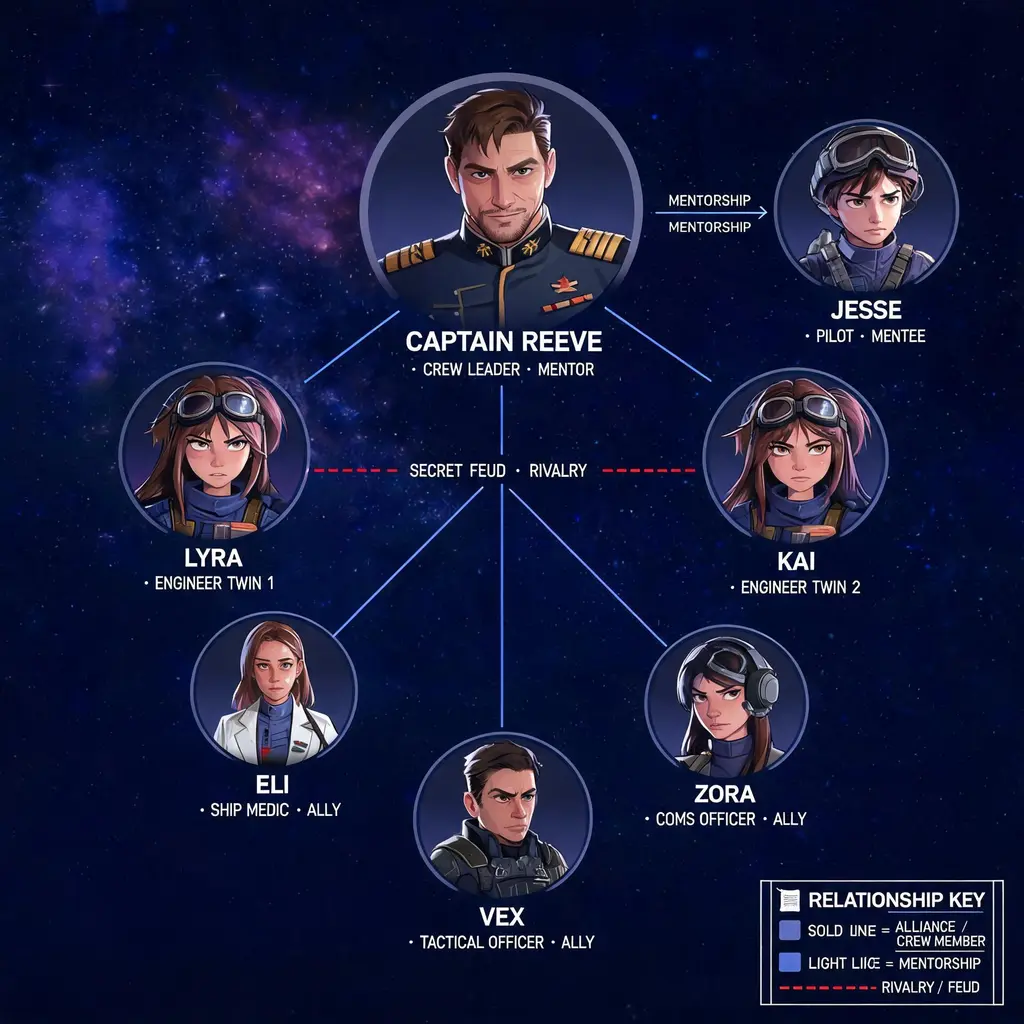
Peta relasi karakter
Ubah deretan karakter menjadi peta relasi sekelas poster dengan garis hubungan berkode warna, vinyet potret, dan gaya visual yang diambil dari dunia ceritanya sendiri.

Infografik perjalanan kopi
Telusuri perjalanan kopi dari kebun ke cangkir dalam poster infografik premium lima tahap, dengan kotak data, ikon, dan palet cokelat kopi serta tembaga, siap dipajang di kafe.
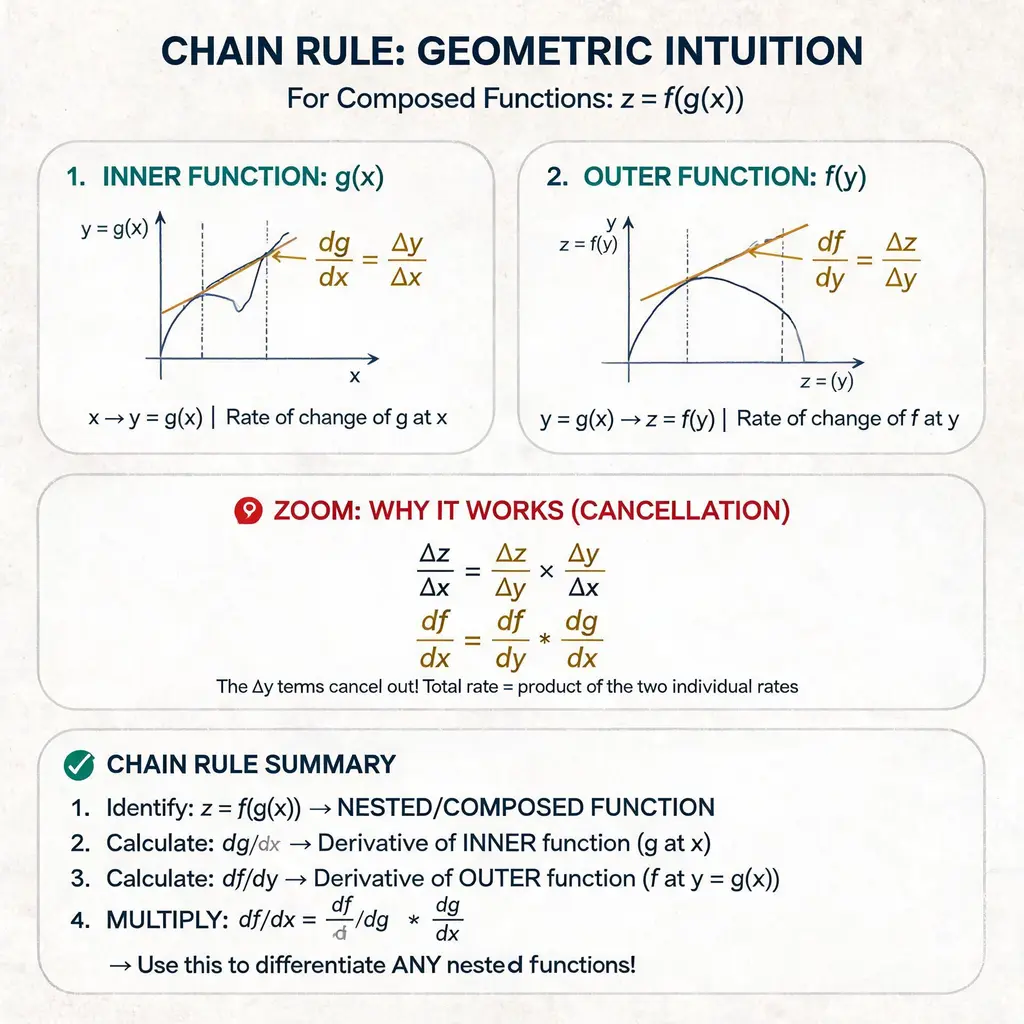
Handout kuliah konsep
Jelaskan konsep apa pun — matematika, teknologi, atau sistem — sebagai handout bergaya kertas yang bersih dengan label bernomor, panah gambar tangan, kotak sorotan zoom, dan bagian ringkasan, seperti lembar kuliah yang indah.