Karte zum Quartalsumsatz
Zeige eine Quartalslinie als vier stehende Felder auf einer Karte und verwende nur die Beschriftungen und Zahlen, die du vorgibst.
Aktualisiert:
Vollständiges Prompt
Englisches Prompt mit einem Vorschlag für deine Anfrage. Passe Motiv und Details vor dem Generieren an. Die ursprünglichen Eingaben und Einstellungen der Beispiele sind nicht vollständig belegt.
Empfohlenes Modell: GPT Image 2.5 Flare
Prompt-Tipps
- Prüfe, ob jeder Wert und der Schlusstext deinem Text entsprechen und keine Zahl dazuerfunden ist.
- Die Karte ist ein Standbild; die Linie bewegt sich nicht und es gibt kein GIF.
Quellen und Urheber
Von OmniArt angepasst und neu formuliert. Quellen, Änderungen und Nutzungsbedingungen sind unten aufgeführt.
- Quarterly revenue chart animation · aiwarts
RaphaelAI-OpenLab/awesome-gpt-image-2.6
The collection's MIT license covers its code, templates and original documentation only; its LICENSE states that third-party prompts, reference images and example outputs keep their own rights. This template is independently authored; no source text or media is copied.
Replaced the fixed series, palette, and growth figure with user-supplied labels and values, and turned the moving chart into four still panels on one card. Source GIF workflow changed to a single still frame strip; no GIF or animation export is promised. The source collection labels this case GPT Image 2.6; GPT Image 2.5 Flare is a recommendation, not a verified example model.
Verwandte Prompt-Rezepte

Buchstaben-Objektraster
Verwandeln Sie einen Buchstaben oder eine Namensregel in ein ordentliches 10×10-Raster aus 100 illustrierten, beschrifteten Objekten auf Weiß — ideal für Klassenzimmer-Poster und Wortschatz-Material.
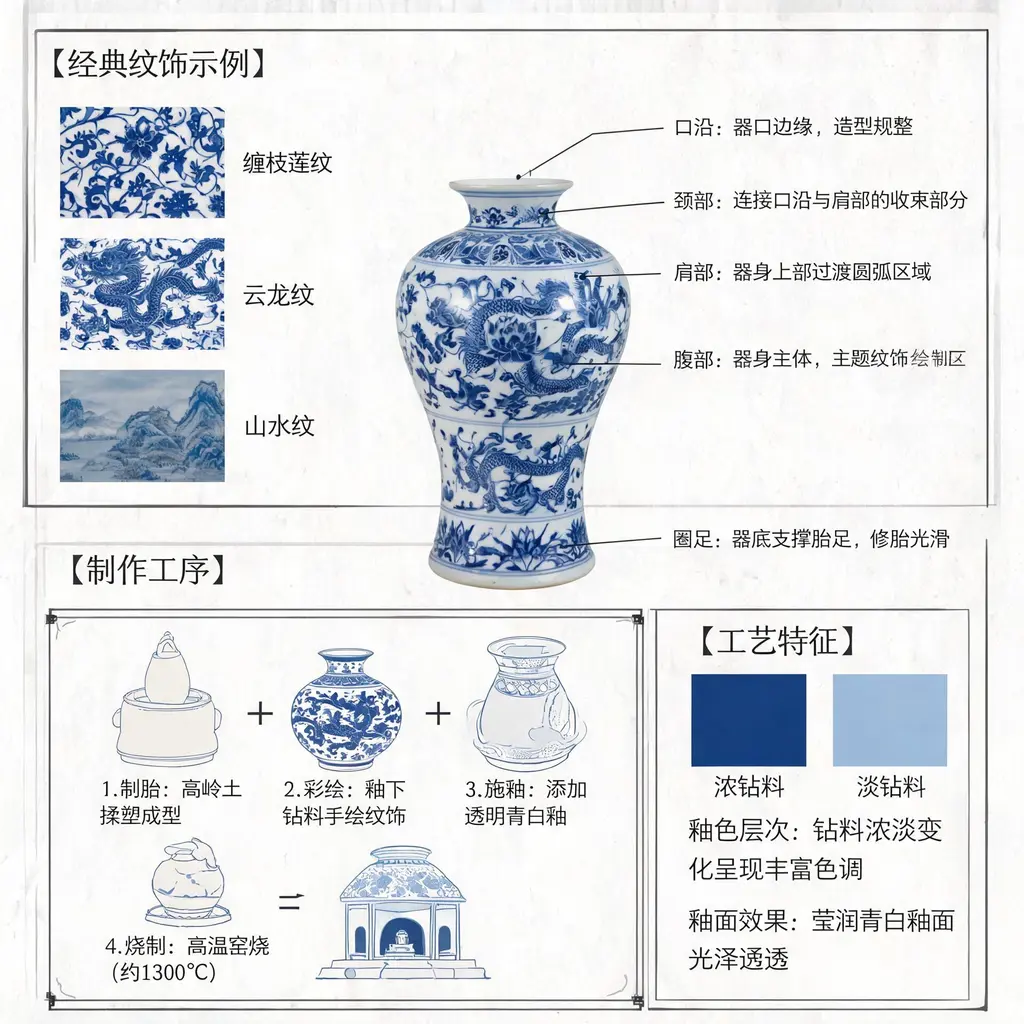
Blau-Weiß-Porzellan-Schaubild
Verwandeln Sie Jingdezhen-Blau-Weiß-Porzellan in ein museumsreifes annotiertes Schaubild mit Strukturlinien, Motiv-Nahaufnahmen und gelehrten chinesischen Anmerkungen zum Handwerk.

Tafel-Erklärbild
Verwandeln Sie jedes Thema oder jeden Artikel in eine handgezeichnete Tafel voller Kreidediagramme, Pfeile und Beschriftungen — eine teilbare Zusammenfassung in einem Bild.
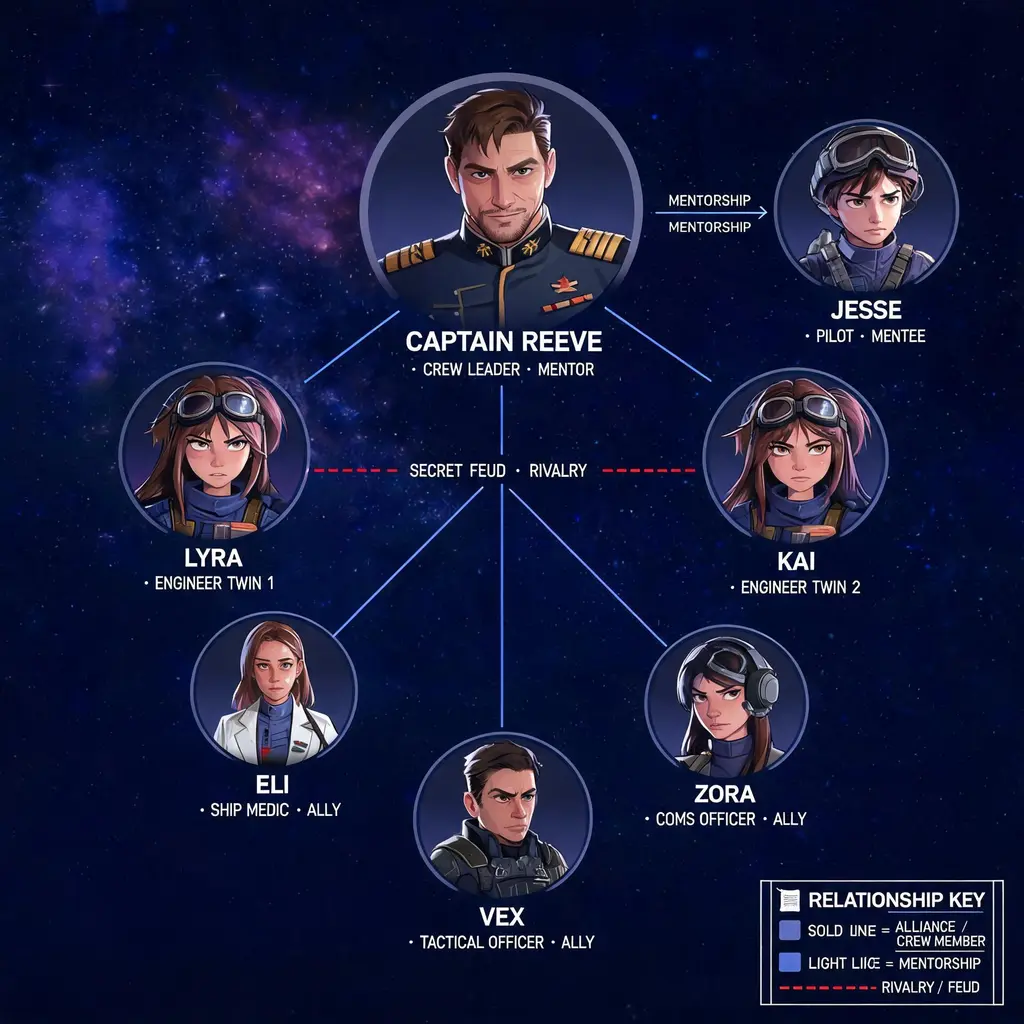
Figuren-Beziehungskarte
Verwandeln Sie ein Figurenensemble in eine posterreife Beziehungskarte mit farbcodierten Verbindungen, Porträtvignetten und einem Stil aus der Welt der Geschichte.

Kaffeereise-Infografik
Verfolgen Sie den Kaffee von der Farm bis in die Tasse: ein hochwertiges Infografik-Poster mit fünf nummerierten Etappen, Datenboxen, Icons und einer Palette aus Kaffeebraun und Kupfer, bereit für die Café-Wand.
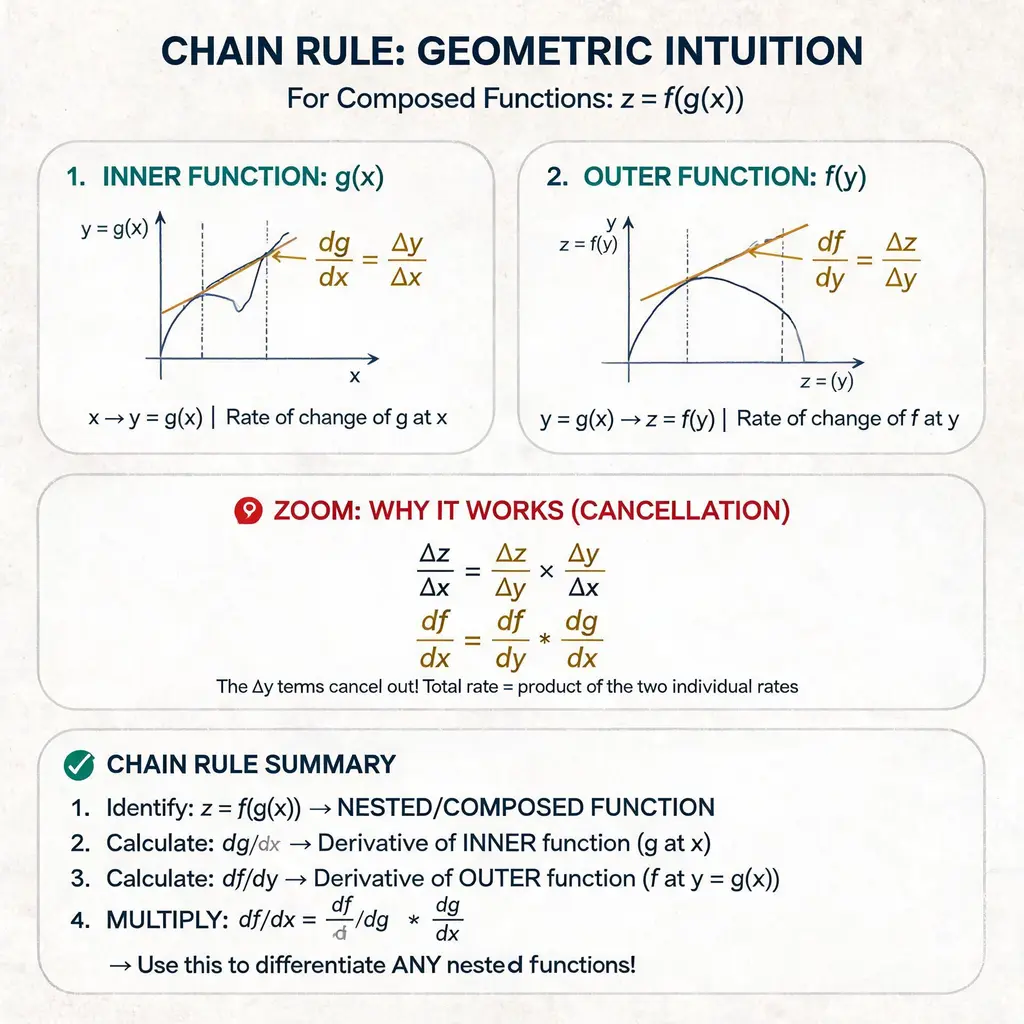
Konzept-Vorlesungshandout
Erklären Sie jedes Konzept — Mathematik, Technik oder Systeme — als sauberes Handout in Papieroptik mit nummerierten Labels, handgezeichneten Pfeilen, Zoom-Kästen und einer Zusammenfassung, wie ein schön gestaltetes Vorlesungsblatt.